Difference between revisions of "Wazuh"
| Line 1: | Line 1: | ||
=== Commands: | == Monitoring == | ||
===How to Monitor=== | |||
There is a lot of information present on the manager page with details on everything connected. Mainly, all the information that will want to be looked at is present on the Security Events, Integrity Monitoring, Agents, and Manager tabs for the information that we will be troubleshooting and coming up with solutions for. The main thing that will need to be looked for are going to be any failures seen on one of the servers or workstations. You will also want to look at the agents connected to see if things are in order or not with connection to the manager. Another thing would be vulnerabilities detected by the manager within our systems and note what kind of vulnerability that it is. The processes being made will also be something that needs to be monitored for any issues on the systems. | |||
===What to look for=== | |||
[[File:ELK.png|thumb|900x900px]] | |||
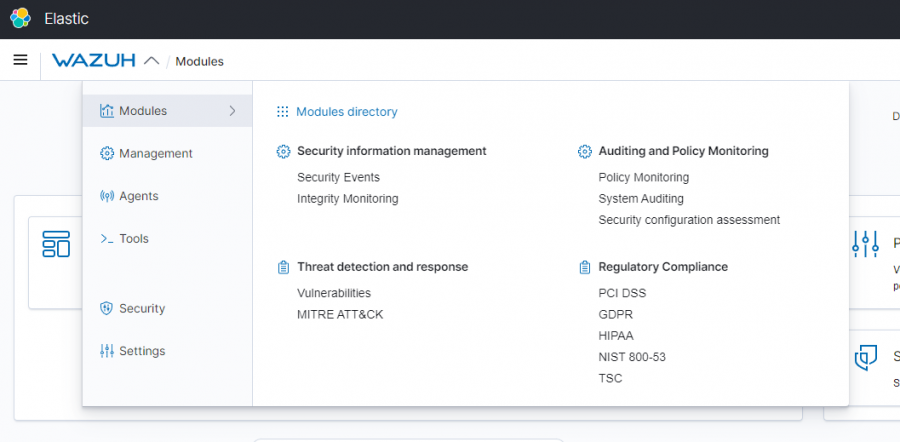
====='''<u>Modules</u>'''===== | |||
* | |||
======'''Security information management'''====== | |||
*Security Events | |||
**Alerts - This will be the main place to look for all of the systems current events taking place as far back as you need to. This will go over any login failures, malware, or anything of that nature will be viewed here across all agents. The key to looking at this all is section through the level of alert going from 1 - 12 with each increase in level being a higher alert that needs to be looked at. Anything above 7 will typically be what is unwanted unless another technician is performing a task that is causing said alerts. Take the proper steps as listed within the policy when any alert is worth being taken to the higher ups for proper handling. | |||
======'''Auditing and Policy Monitoring'''====== | |||
*Security Configuration Assessments | |||
**Here will be the most important place to look as you will need to monitor for any faults detected in the system's security. One of each device (All servers need to be checked) and then you as a tech will need to research into the issue if it is important. If there is a major security issue then this can be dealt with either by informing a higher up and getting the all clear to fix it, or if you are already in charge of fixing the security of the systems. | |||
====='''''<u>Management</u>'''''===== | |||
======'''Administration'''====== | |||
*This will probably be the most unused section of the SIEM, but if multiple technicians ever take it on then here is where all accounts would be managed depending on the trust within that technician, so restrictions can be set to ensure that all users have the correct access on the server, ensuring that nothing will be used against policy. This is also where rules will be configured for the nodes and clusters mainly for what will be showed on the virtual machine | |||
======'''Status and Reports'''====== | |||
*This is where you will be able to generate a status report of the SIEM as well as seeing the status of each manager/cluster. By generating a report you will be given a detailed pdf of everything that has been logged for when you set it and you will be able to go over it and see anything that sticks out instead of having to check each individual module on the SIEM. You will also view the cluster health by seeing if one of the nodes has gone down and needs to be repaired to get it in working order once more. | |||
====='''<u>Agent</u>'''===== | |||
*Any and all issues that are had within the agent monitoring page can be checked for in the troubleshooting section of the [[SIEM: Configuration|SIEM: Configuration wiki page]]. | |||
======'''Active'''====== | |||
*Here you will be looking for any and all agents connected to the SIEM. You will look here for any newly added agents that are supposed to be there as well as if they have properly connected. | |||
======'''Disconnected'''====== | |||
*You will look here to see if any important agents such as the servers are disconnected due to it being turned off or if it has been inactive for quite a while as they may need to be reset which can be done in many ways. | |||
======'''Never connected'''====== | |||
*This will be used to check for any agents that have been connected improperly due to human error or any oversight that had happened during the configuration. If this happens to occur then some of the issues with the setup of an agent should be able to be fixed by viewing previous troubleshooting, but if the issue is unknown, then consult either the Wazuh documentation or a manager. | |||
===Proper Procedure=== | |||
For whoever is tasked with the job of monitoring the SIEM at any given time needs to know the procedure to do so. Down below will be a list of what should be done when one is to check over our systems. Anything not stated on this list will only be checked as need or if something has been change on the server that needs to be check for on the web based page. | |||
=== Check all tabs for disconnect or never connected agents '''(Daily)''' === | |||
#*If there are any that have been disconnected or have never connected, follow the process above for this section to solve the problem. | |||
#Click onto agents and look at the alerts '''(Daily)''' | |||
#*Look to see if alerts are still being tracked, if not then follow the steps in the SIEM: Configuration page in troubleshooting. | |||
#*(sort by level from highest to lowest for higher priority alerts) for any that are notable. If one happens to be a clear issue then report it. | |||
#Go into the Security Configuration Assessment for security vulnerabilities '''(Once Weekly or when any big changes are made during imaging)''' | |||
#*Check one Windows, Mac, and all of the Servers for any fails that have been detected by the SIEM. | |||
#*Take a screenshot of each, then send it to whoever is in charge of creating images so that they can review previous issues. | |||
#Check in the status and reports '''(End of week)''' | |||
#*Look at the health of the cluster/nodes. | |||
#*Check the logs and statistics section for any irregular spikes or gaps in the information (Unless it is due to the server being shutoff) | |||
#* | |||
#*Generate a final report and compare with previous reports if there are any discrepancies between the two. | |||
#Check on both of the node vm's in order to get updates installed for the managers '''(Monthly or after a new version comes out.)''' | |||
#*Install when the prompt comes up to do so or go into the terminal and use the '''Sudo apt-get update''' Which can be used to update the Ubuntu software and the SIEM as well. | |||
#*Reconfigure as needed in the different config files. It is best to get a screenshot of these files before updating to avoid any disconnect between the server and the agents. | |||
If any issues do occur, make sure to report it first so that it can be dealt with appropriately. Do not attempt to make corrections if you are unable to fix the issue or make it worse as you will take responsibility. | |||
===Reporting=== | |||
[[File:Email.png|thumb|Config for email|500x500px]][[File:Report.png|thumb|Config for reports|430x430px]]Reports from the manager can be set up to email the information directly to us. In order to do this the '''Ossec.conf file''' needs to be edited to set up automatic reports by using the command With this you can choose who will receive it, the frequency of emails, and the level of alert it will send an email for once your information is filled into the box. Once you have made it in there will be a section to input a sending email and the recipient email, whatever your purpose is for receiving the email will most likely be for the higher alerts that need fixing immediately. | |||
This is the command needed to access the ossec.conf file on the virtual machine. | |||
'''sudo nano /var/ossec/etc/ossec.conf''' | |||
'''''<big>Do not under any circumstance, unless told otherwise by a higherup, configure anything within the Ossec.Conf file on either of the nodes or anything on the server web page or as it will lead to the server malfunctioning or not performing at its best. Any and all changes made need to be reported and approved by whoever the manager is at the time or with the Founder and CEO, Mr. Chamberlain.</big>''''' | |||
== Commands: == | |||
====<u>Agent Config (Agent Side)</u>==== | ====<u>Agent Config (Agent Side)</u>==== | ||
Revision as of 15:13, 16 September 2022
Monitoring
How to Monitor
There is a lot of information present on the manager page with details on everything connected. Mainly, all the information that will want to be looked at is present on the Security Events, Integrity Monitoring, Agents, and Manager tabs for the information that we will be troubleshooting and coming up with solutions for. The main thing that will need to be looked for are going to be any failures seen on one of the servers or workstations. You will also want to look at the agents connected to see if things are in order or not with connection to the manager. Another thing would be vulnerabilities detected by the manager within our systems and note what kind of vulnerability that it is. The processes being made will also be something that needs to be monitored for any issues on the systems.
What to look for
Modules
Security information management
- Security Events
- Alerts - This will be the main place to look for all of the systems current events taking place as far back as you need to. This will go over any login failures, malware, or anything of that nature will be viewed here across all agents. The key to looking at this all is section through the level of alert going from 1 - 12 with each increase in level being a higher alert that needs to be looked at. Anything above 7 will typically be what is unwanted unless another technician is performing a task that is causing said alerts. Take the proper steps as listed within the policy when any alert is worth being taken to the higher ups for proper handling.
Auditing and Policy Monitoring
- Security Configuration Assessments
- Here will be the most important place to look as you will need to monitor for any faults detected in the system's security. One of each device (All servers need to be checked) and then you as a tech will need to research into the issue if it is important. If there is a major security issue then this can be dealt with either by informing a higher up and getting the all clear to fix it, or if you are already in charge of fixing the security of the systems.
Management
Administration
- This will probably be the most unused section of the SIEM, but if multiple technicians ever take it on then here is where all accounts would be managed depending on the trust within that technician, so restrictions can be set to ensure that all users have the correct access on the server, ensuring that nothing will be used against policy. This is also where rules will be configured for the nodes and clusters mainly for what will be showed on the virtual machine
Status and Reports
- This is where you will be able to generate a status report of the SIEM as well as seeing the status of each manager/cluster. By generating a report you will be given a detailed pdf of everything that has been logged for when you set it and you will be able to go over it and see anything that sticks out instead of having to check each individual module on the SIEM. You will also view the cluster health by seeing if one of the nodes has gone down and needs to be repaired to get it in working order once more.
Agent
- Any and all issues that are had within the agent monitoring page can be checked for in the troubleshooting section of the SIEM: Configuration wiki page.
Active
- Here you will be looking for any and all agents connected to the SIEM. You will look here for any newly added agents that are supposed to be there as well as if they have properly connected.
Disconnected
- You will look here to see if any important agents such as the servers are disconnected due to it being turned off or if it has been inactive for quite a while as they may need to be reset which can be done in many ways.
Never connected
- This will be used to check for any agents that have been connected improperly due to human error or any oversight that had happened during the configuration. If this happens to occur then some of the issues with the setup of an agent should be able to be fixed by viewing previous troubleshooting, but if the issue is unknown, then consult either the Wazuh documentation or a manager.
Proper Procedure
For whoever is tasked with the job of monitoring the SIEM at any given time needs to know the procedure to do so. Down below will be a list of what should be done when one is to check over our systems. Anything not stated on this list will only be checked as need or if something has been change on the server that needs to be check for on the web based page.
Check all tabs for disconnect or never connected agents (Daily)
- If there are any that have been disconnected or have never connected, follow the process above for this section to solve the problem.
- Click onto agents and look at the alerts (Daily)
- Look to see if alerts are still being tracked, if not then follow the steps in the SIEM: Configuration page in troubleshooting.
- (sort by level from highest to lowest for higher priority alerts) for any that are notable. If one happens to be a clear issue then report it.
- Go into the Security Configuration Assessment for security vulnerabilities (Once Weekly or when any big changes are made during imaging)
- Check one Windows, Mac, and all of the Servers for any fails that have been detected by the SIEM.
- Take a screenshot of each, then send it to whoever is in charge of creating images so that they can review previous issues.
- Check in the status and reports (End of week)
- Look at the health of the cluster/nodes.
- Check the logs and statistics section for any irregular spikes or gaps in the information (Unless it is due to the server being shutoff)
- Generate a final report and compare with previous reports if there are any discrepancies between the two.
- Check on both of the node vm's in order to get updates installed for the managers (Monthly or after a new version comes out.)
- Install when the prompt comes up to do so or go into the terminal and use the Sudo apt-get update Which can be used to update the Ubuntu software and the SIEM as well.
- Reconfigure as needed in the different config files. It is best to get a screenshot of these files before updating to avoid any disconnect between the server and the agents.
If any issues do occur, make sure to report it first so that it can be dealt with appropriately. Do not attempt to make corrections if you are unable to fix the issue or make it worse as you will take responsibility.
Reporting
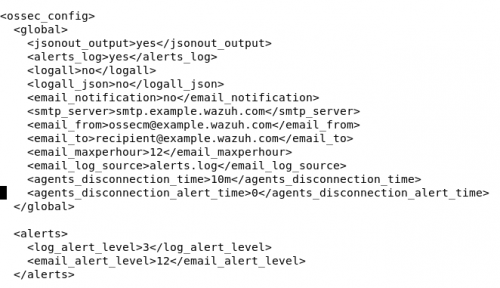
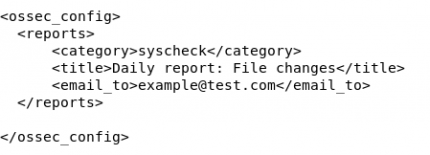
Reports from the manager can be set up to email the information directly to us. In order to do this the Ossec.conf file needs to be edited to set up automatic reports by using the command With this you can choose who will receive it, the frequency of emails, and the level of alert it will send an email for once your information is filled into the box. Once you have made it in there will be a section to input a sending email and the recipient email, whatever your purpose is for receiving the email will most likely be for the higher alerts that need fixing immediately.
This is the command needed to access the ossec.conf file on the virtual machine.
sudo nano /var/ossec/etc/ossec.conf
Do not under any circumstance, unless told otherwise by a higherup, configure anything within the Ossec.Conf file on either of the nodes or anything on the server web page or as it will lead to the server malfunctioning or not performing at its best. Any and all changes made need to be reported and approved by whoever the manager is at the time or with the Founder and CEO, Mr. Chamberlain.
Commands:
Agent Config (Agent Side)
net stop wazuh
net start wazuh
Restart-Service -Name wazuh
Agent Config (Server Side)
/var/ossec/bin/manage_agents -a <agent_IP> -n <agent_name>
/var/ossec/bin/manage_agents -l | grep <agent_name>
/var/ossec/bin/manage_agents -e <agent_id>
Server Config - Nano
systemctl start/status/stop/restart wazuh-manager
/usr/share/kibana/data/wazuh/config/wazuh.yml
/var/ossec/etc/shared/dbms/agent.conf
/var/ossec/etc/ossec.conf
/etc/filebeat/filebeat.yml
/etc/kibana/kibana.yml
/var/ossec/bin/wazuh-control -j info
/var/ossec/logs/active-responses.log


